Monitoring — Kubernetes

Always learning
7 min readNov 30, 2023

Kubernetes is a cluster management system that provides a way to monitor and manage containerized applications.

Monitoring Kubernetes can be done in a number of ways, but the most popular is through the use of Heapster.

Heapster is an open-source project that collects metrics from the Kubernetes cluster and exposes them as time series data streams in prometheus format. It also generates static reports for easy consumption by humans or other systems.

The following are some of the metrics Heapster gathers:

  1. CPU utilization
  2. Memory utilization
  3. Number of pods per node
  4. Number of containers per pod
  5. Number of containers per host
  6. Number of hosts
  7. Number of machines
  8. Time since last restart

Kubernetes monitoring is a form of reporting that helps with proactive management of clusters.

Monitoring a Kubernetes cluster eases management of containerized infrastructure by tracking utilization of cluster resources including memory, CPU, and storage.

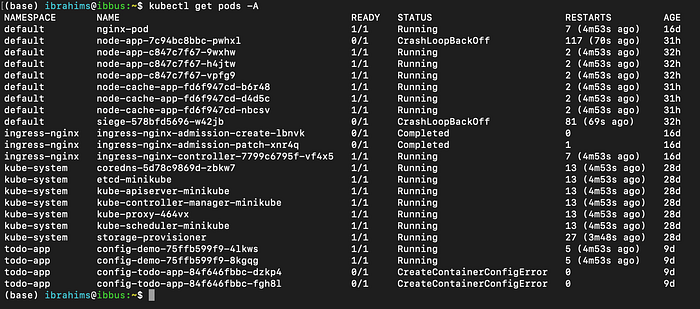
Check the default installation

kubectl get pods -A

Prometheus install the two-way

  1. Helm
  2. Operator — Advanced Capabilities

An open-source monitoring tool, Prometheus seems to be the King 👑 of all the monitoring tools out there as of today. Prometheus on Kubernetes is used for metrics-based monitoring and alerting. It pulls the real-time metrics, compresses and stores them in a time-series database.

The Prometheus sends an HTTP request (pull) called Scrape, found on the configuration in the deployment. It provides a query language and a robust data model that provides detailed and actionable metrics.

Prometheus Architecture

  • Time Series Database that stores all the metric data like current CPU usage, memory usage etc.
  • Data Retrieval Worker is responsible for all the data pulling activities from applications, services, servers etc. and pushing them into the database.
  • HTTP Server API meant to accept queries for the stored data. The Server API is used to display the data in a dashboard or a Web UI.

Now we are look at the first (helm) method

Install Helm for Kubernetes on Mac

brew install kubernetes-helm

First check helm installed or not

helm

Add helm repo

helm repo add prometheus-community https://prometheus-community.github.io/helm-charts

Update helm repo

helm repo update

To install Prometheus Helm Chart on Kubernetes Cluster, run this helm install command:

helm install prometheus prometheus-community/prometheus

Check the pods

kubectl get pods

Prometheus pods are running on minikube

Kube-state-metrics (default installation) is a listening service that generates metrics about the state of Kubernetes objects through leveraging the Kubernetes API.

The Helm Chart installation creates the following Kubernetes resources:

  • Pods: It hosts the deployed Prometheus Kubernetes application inside the cluster.
  • Replica Sets: A collection of instances of the same application inside the Kubernetes cluster. It enhances application reliability.
  • Deployments: It is the blueprint for creating the application pods.
  • Services: It exposes the pods running inside the Kubernetes cluster. We use it to access the deployed Kubernetes application.

Access the application using the Kubernetes services for Prometheus. To get all the Kubernetes Services for Prometheus, run this command:

kubectl get svc

Use the prometheus-server Kubernetes service to access the Prometheus application. The prometheus-server is a ClusterIPtype. You can only access it within the Kubernetes cluster.

We need to expose this Kubernetes service to access it outside the Kubernetes cluster. Exposing the prometheus-server Kubernetes service will generate a URL. We can load the URL on our browser and access the running application.

This command will convert the ClusterIP type to the NodePort type

kubectl expose service prometheus-server --type=NodePort --target-port=9090 --name=prometheus-server-ext

Again check service

kubectl get svc

Now we have exposed the prometheus-server Kubernetes service. Let’s access the Prometheus application using the following command:

minikube service prometheus-server-ext

It might take a few moments for the URL to be available. You need to make several retries on your browser until you access the Prometheus Kubernetes application using this URL. You also need to keep the terminal open and the tunnel command running in order to keep accessing the service.

Prometheus is running inside the cluster and we can access it using a browser/URL.

Grafana is a data visualization and monitoring platform. It allows users to create dashboards that display data from a variety of sources, including Prometheus, Elasticsearch, and InfluxDB.

Grafana provides a variety of charts and graphs that can be used to visualize data, and it also allows users to create custom dashboards.

To get this Grafana Helm chart, run this command:

helm repo add grafana https://grafana.github.io/helm-charts
helm repo update

Install Grafana Helm Chart on Kubernetes Cluster

helm install grafana grafana/grafana

We have installed Grafana on the Kubernetes Cluster. We can access the Grafana server via port 80. The next step is to access and launch the Grafan application. You will access the application using the Kubernetes services for Grafana.

kubectl get service

Exposing the grafana Kubernetes Service

To expose the grafana Kubernetes service.

This command will convert the ClusterIP type to the NodePort type. It makes the grafana accessible outside the Kubernetes Cluster on port 3000. Now we have exposed the grafana Kubernetes service.

kubectl expose service grafana --type=NodePort --target-port=3000 --name=grafana-ext
kubectl get svc

Let’s access the Grafana application using the following command:

minikube service grafana-ext

The image above shows the Grafana Login page. To get the password for admin, run this command on a new terminal

kubectl get secret --namespace default grafana -o jsonpath="{.data.admin-password}" | base64 --decode ; echo

Login into Grafana

To login into Grafana, input admin as the user name and your generated password. It will launch a Welcome to Grafana home page as shown below

Now it the time to add Prometheus as the data source. To add Prometheus as the data source, follow these steps:

  • On the Welcome to Grafana Home page, click Add your first data source:
  • Select Prometheus as the data source:
  • You will then add the URL where your Prometheus application is running. This is the first URL (internal to the cluster) shown when we ran minikube service prometheus-server-ext earlier.

Click on “Save & test” to save your changes.

You have finished integrating Prometheus and Grafana on Kubernetes with Helm. The last step is to create a Grafana Dashboard. It will help us to visualize our Kubernetes cluster metrics.

Grafana Dashboard

Creating your dashboards from scratch.

To import a Grafana Dashboard

Dashboards → New dashboard → Import dashboard

3662 ← ID name ← Grafana Standard ID

You can choose default option

You get a dashboard

--

--

Always learning

கற்றுக் கொள்ளும் மாணவன்...